Dynamic Layer Detection of Thin Materials using DenseTact Optical Tactile Sensors

Stanford University

Armlab Logo
Method Image.

Our custom gripper grasps a thin material and performs a rubbing motion for layer classification. As shown on the left, the gripper can be mounted directly on a LoCoBot for more complex tasks. The right shows (a) the DenseTact RGB images, (b) the model inputs of optical flow, wrench, and joint states, and (c) the classification results.

Abstract

Manipulation of thin materials is critical for many everyday tasks and remains a significant challenge for robots. While existing research has made strides in tasks like material smoothing and folding, many studies struggle from common failure modes (crumpled corners/edges, incorrect grasp configurations) that a preliminary step of layer detection can solve. We present a novel method for classifying the number of grasped material layers using a custom gripper equipped with DenseTact 2.0 optical tactile sensors. After grasping a thin material, the gripper performs an anthropomorphic rubbing motion while collecting optical flow, 6-axis wrench, and joint state data. Using this data in a transformer-based network achieves a test accuracy of 98.21% in correctly classifying the number of grasped cloth layers, and 81.25% accuracy in classifying layers of grasped paper, showing the effectiveness of our dynamic rubbing method. Evaluating different inputs and model architectures highlights the usefullness tactile sensor information and a transformer model for this task. A comprehensive dataset of 568 labeled trials (368 for cloth and 200 for paper) was collected and made open-source along with this paper.

Contributions

  • A compact, 4 DOF gripper equipped with DenseTact 2.0 sensors, capable of performing a rubbing motion between its fingers.
  • A dataset for layer classification based on tactile sensor output. Included classes are 0, 1, 2, and 3 layers of cloth and paper.
  • A transformer-based network that successfully classifies the number of cloth and paper layers using optical flow, wrench, and joint state data taken during the gripper’s rubbing motion. This network can run in real time during a rubbing motion to classify layers based on the most recent image captures at 3 Hz using an NVIDIA GeForce RTX 4080 GPU.
Method Image.

Hardware

The hardware setup for the gripper is shown below. The gripper is equipped with DenseTact 2.0 sensors as the fingertips and is capable of performing a rubbing motion between its fingers, measuring optical flows and net wrenches while recording its motor joint states. There are two DYNAMIXEL XL330-M288-T on each finger, chosen for their light weight and compact design, and controlled by an OpenRB-150 Arduino-compatible embedded controller. All gripper componenents communicate via ROS2 to perfrom dynamic layer classification.

Method Image.

Network Architecture

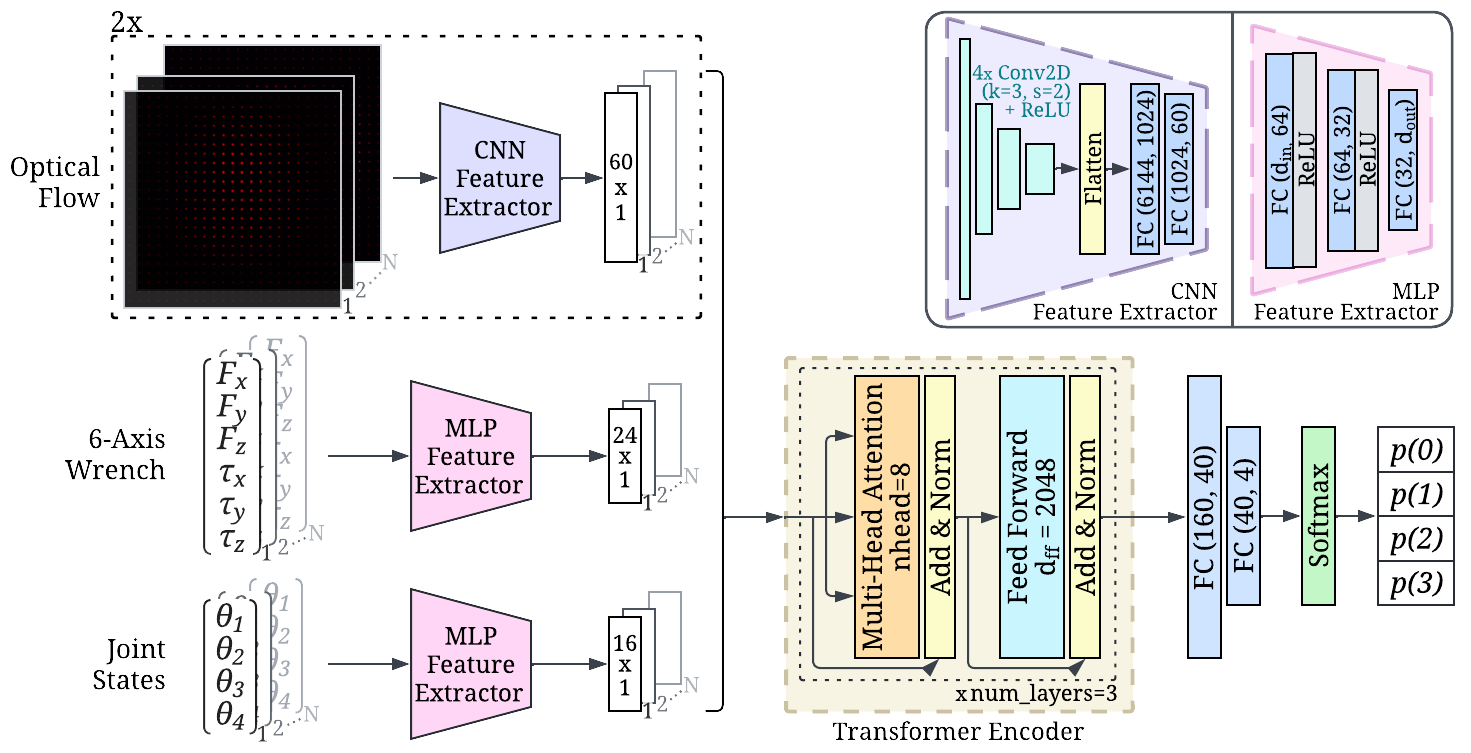
A transformer based neural network was used to classify each grasp and rubbing motion into one of the four labels (0, 1, 2, or 3 layers). The model inputs are N-length time sequences of optical flow, 6-axis wrench, and joint state data (N=200). Extracted features from each input are concatenated and fed into a transformer 
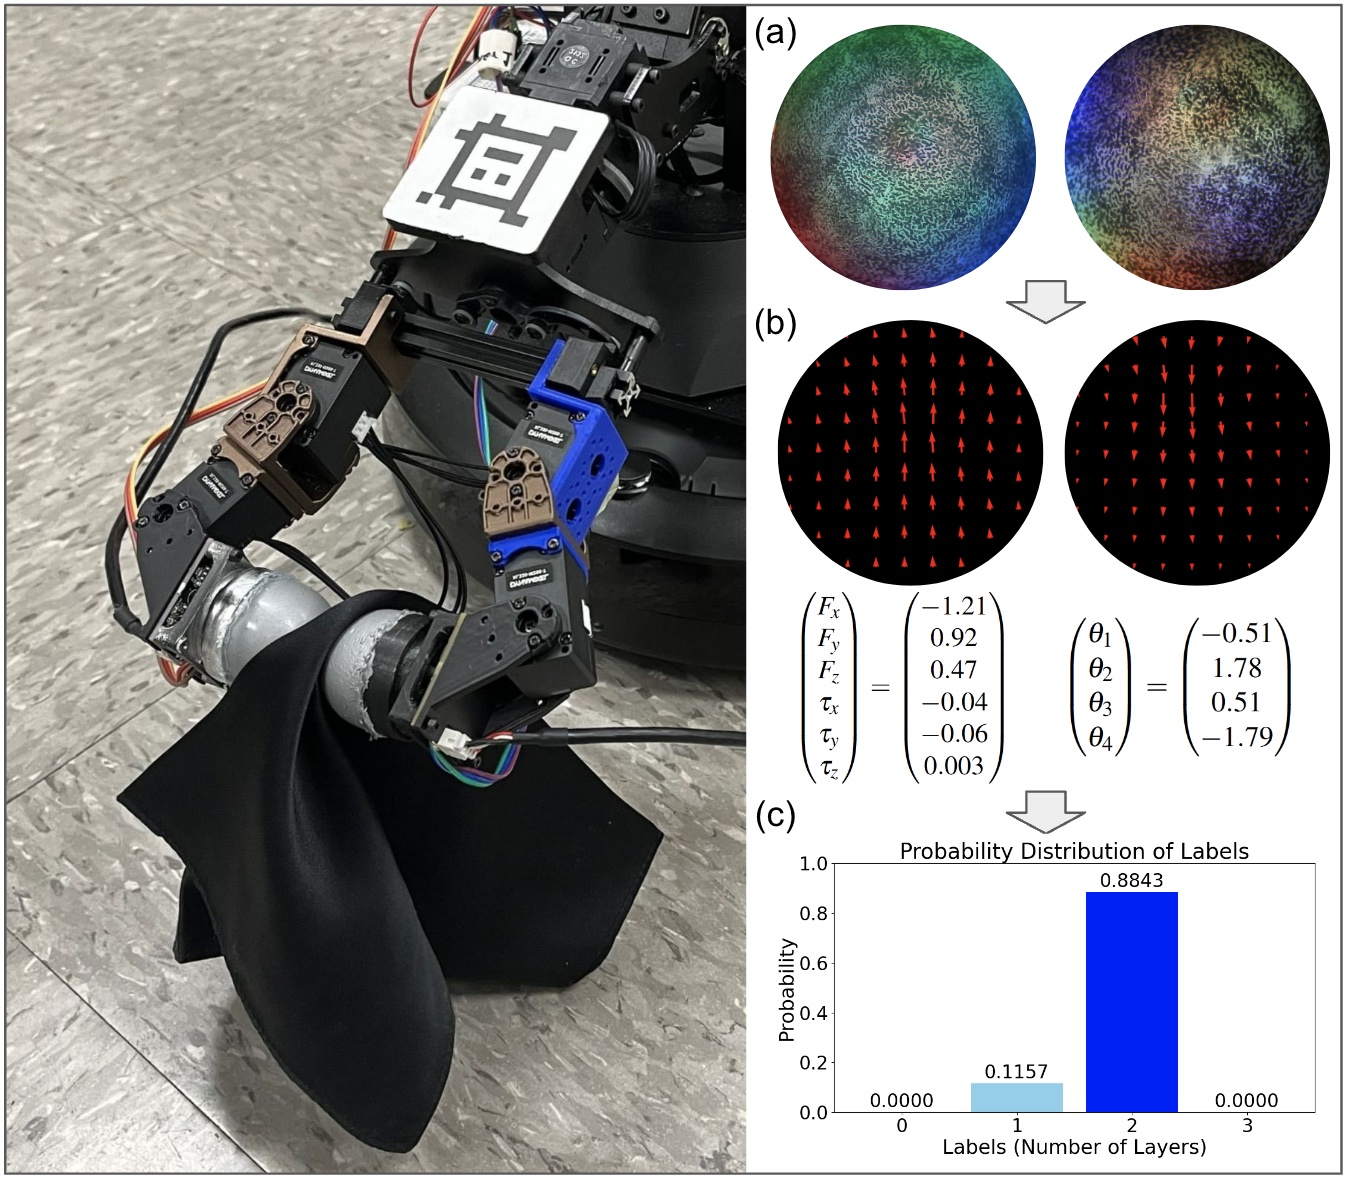
encoder, followed by fully-connected layers and a softmax function. The resulting output is the probability distribution across the 4 classes (0, 1, 2 and 3 layers). Ablations to optimize for the best model architecture were completed, and are described in depth in the paper.

Method Image.

Experiments

A dataset of 568 labeled trials was collected and made publically available here: ATTACH URL. Raw RGB video streams are included, while optical flow, joint state, and net wrench data is available as npz files. The README details instructions on using the data.

Rubbing Motion for All Labels
Confusion Matrices

Based on the best architecture for cloth data derived from the ablation study, confusion matrices across training epochs and test trials are presented. In testing, only one trial of cloth data was misclassified of the 56 total, giving an accuracy of 98.21% on unseen cloth data.

3D T-SNE Plots

We used 3D T-SNE plots to visualize the latent features for our highest-performing model trained and tested on cloth data. The latent vector output of the network is 4-dimensional, which is reduced down to three dimensions by T-SNE here for easier visual comprehension. The four interactive 3D plots show the feature space for all combinations of the four class labels of the best model for cloth data.

BibTeX

@misc{dhawan2024dynamiclayerdetectionsilk,
      title={Dynamic Layer Detection of Thin Materials using DenseTact Optical Tactile Sensors}, 
      author={Ankush Kundan Dhawan and Camille Chungyoun and Karina Ting and Monroe Kennedy III au2},
      year={2024},
      eprint={2409.09849},
      archivePrefix={arXiv},
      primaryClass={cs.RO},
      url={https://arxiv.org/abs/2409.09849}, 
}